Using the Debugger
Topics Covered In This Chapter:
- 3 Different Types of Errors
- IDLE's Debugger
- Stepping Into, Over, and Out
- Go and Quit
- Break Points
Bugs!
"On two occasions I have been asked, 'Pray, Mr. Babbage, if you put into the machine wrong figures, will the right answers come out?' I am not able rightly to apprehend the kind of confusion of ideas that could provoke such a question."
-Charles Babbage, 19th century English mathematician, philosopher, inventor and mechanical engineer who originated the concept of a programmable computer. http://en.wikipedia.org/wiki/Charles_Babbage
If you enter the wrong code, the computer will not give you the right program. A computer program will always do what you tell it to, but what you tell the program to do might not be the same as what you wanted the program to do. A bugs is another name for an error or problem in a computer program. Bugs happen when the programmer has not carefully thought about what exactly the program is doing. There are three types of bugs that can happen with your program:
- Syntax Errors are a type of bug that comes from typos in your program. When the Python interpreter sees a syntax error, it is because your code is not written in proper Python language. A Python program with even a single syntax error will not run.
- Runtime Errors are bugs that happen while the program is running (that is, executing). The program will work up until it reaches the line of code with the error, and then the program terminates with an error message (this is called crashing). The Python interpreter will display something called a "traceback" and show the line where the problem happens.
- Semantic Errors are the trickiest bugs to fix. This bug does not crash the program, and the program appears to work fine. However, it is not doing what the programmer intended for the program to do. For example, if the programmer wants the variable total to be the sum of the values in variables a, b, and c but writes total = a + b * c, then the value in total will be wrong. This won't cause the program to crash immediately, but may or may not cause some other code to crash later on because of the unexpected value in total.
Finding bugs in our program can be hard, if you even notice them at all! When running your program, you may discover that sometimes functions are not called when they are suppose to be, or maybe they are called too many times. You may code the condition for a while loop wrong, so that it loops the wrong number of times. (A loop in your program that never exits is a kind of bug is called an infinite loop. In order to stop this program, you can press Ctrl-C in the interactive shell.) Any of these things could mistakenly happen in your code if you are not careful.
It can be hard to figure out how your code could be producing a bug because all the lines of code get executed very quickly and the values in variables change so often. A debugger is a program that lets you step through your code one line at a time (in the same order that Python executes them), and shows what values are stored in all of the variables. A debugger lets you look at how each line of code affects your program. This can be very helpful to figure out what exactly the program is doing.
A video tutorial on using the debugger that comes with IDLE can be found on this book's website at http://inventwithpython.com/videos/
Starting the Debugger
In IDLE, go ahead and open the Dragon Realm game that you made in the last chapter. In the interactive shell, click on File and then Open, and then select dragon.py (or whatever you named the file when you saved it).
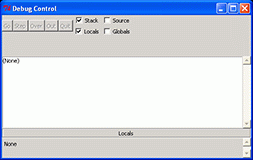
After opening the dragon.py file, click on the Debug menu item at the top of the interactive shell, and then click Debugger to make the Debug Control window appear (Figure 7.1).
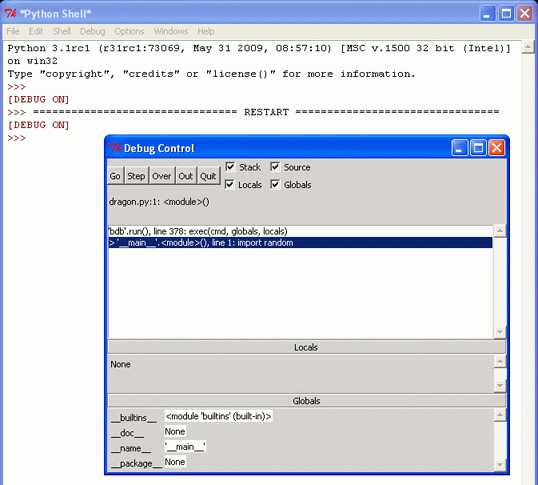
Now when you run the Dragon Realm game (by pressing F5 or clicking Run, then Run Module in the file editor window's top menu), the debugger program will be activated. This is called running a program "under a debugger". In the Debug Control window, check the Source and Globals checkboxes. Then run the program by pressing F5 in the file editor window (Figure 7.2).
When you run Python programs with the debugger activated, the program will stop before it executes the first line of code. If you click on the file editor window's title bar (and you have checked the Source checkbox in the Debug Control window), the first line of code is highlighted in gray. Also, the Debug Control window shows that you are on line 1, which is the import random line.
The debugger lets you execute one line or code at a time (called "stepping"). To execute a single instruction, click the Step button in the Debug Window. Go ahead and click the Step button once. This will cause the Python interpretter to execute the import random instruction, and then stop before it executes the next instruction. The Debug Control window will change to show that you are now on line 2, the import time line.
Stepping
Stepping is the process of executing one instruction of the program at a time. Doing this lets you see what happens after running a single line of code, which can help you figure out where a bug first appears in your programs.
The Debug Control window will show you what line is about to be executed when you click the Step button in the Debug Control window. This window will also tell you what line number it is on and show you the instruction itself.
Click the Step button again to run the import time instruction. The debugger will execute this import statment and then move to line 4. The debugger skipped line 3 because it is a blank line. Notice that you can only step forward with the debugger, you cannot go backwards.
Click the Step button three more times. This will execute the three def statements to define the functions. The debugger skips over the def-blocks of these functions because we are only defining the functions, not calling them. As you define these functions, they will appear in the Globals area of the Debug Control window.
The text next to the function names in the Global area will look something like "<function checkCave at 0x012859B0>". The module names also have confusing looking text next to them, such as "<module 'random' from 'C:\\Python25\\lib\\random.pyc'>". This is only useful to advanced Python programmers, and you don't need to know what this means to debug your programs. Just seeing that the functions and modules are there in the Global area will tell you if the function has been defined or the module has been imported. You can also ignore the __builtins__, __doc__, and __name__ lines in the Global area.
The debugger will now be (after clicking Step four times) at line 35, the playAgain = 'yes' line. When you click Step to execute this line, the playAgain variable will be created and will show up in the Global area. Next to it will be the value stored in this variable, which is the string 'yes'. The debugger lets you see the values of all the variables in the program as the run program runs. This can be very useful if you need to fix your programs.
The Global area in the Debug Control window is where all the global variables are stored. Global variables are the variables that are created outside of any functions (that is, in the global scope). There is also a Local area, which shows you the local scope variables and their values. The local area will only have variables in it when the program execution is inside of a function. Since we are still in the global scope, this area is blank.
The Python debugger (and almost all debuggers) only lets you step forward in your program. Once you have executed an instruction, you cannot step backwards and undo the instruction.
The Go and Quit Buttons
If you get tired of clicking the step button over and over again, and just want the program to run normally, click the Go button at the top of the Debug Control window. This will tell the program to run as if you didn't have the debugger turned on.
If you ever want to terminate the program while it is running, just click the Quit button at the top of the Debug Control window. The program will immediately exit. This can be handy if you want to stop the program and start debugging it from the beginning again.
Stepping Into, Over, and Out
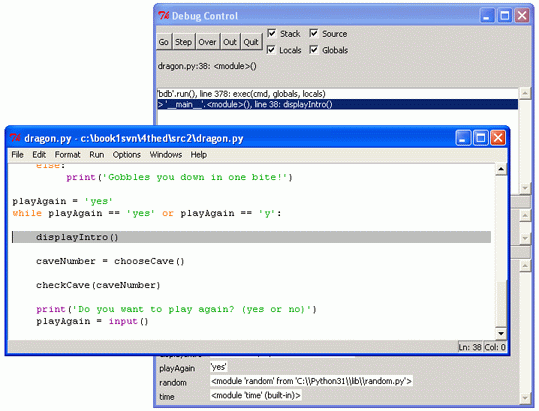
Start the Dragon Realm program with the debugger, and keep stepping (by clicking the Step button in the Debug Control window) until the debugger is at line 38 (the call to displayIntro() line). When you click Step again, the debugger will jump into this function call and appear on line 5 (the first line in the def-block of the displayIntro() function. The kind of stepping we have been doing is called stepping into, because it will step into function calls.
If you click Step a few more times, you will see the output of the print() function call appear in the interactive shell window one at a time. When you step over the last print() function call in the displayIntro() function, the debugger will jump back to the first line (line 40) after function call.
Click Step one more time to step into the choosecave function. Keep stepping through the code until you execute the function call raw_input() call. The program will wait until you type a response into the shell, just like when you run the program normally. If you try clicking the Step button now, nothing will happen because the program will wait for a response.
Enter a response by clicking back on the interactive shell window and type which cave you want to enter. You have to click on the bottom line in the shell before typing. If you are typing but nothing appears on the screen (and the blinking cursor is not below the Which cave will you go into? (1 or 2) text), then you have not clicked on the last line of the shell window.
Once you press the Enter key to enter your response, the debugger will continue to step lines of code again. Instead of clicking Step, try clicking the Out button on the Debug Control window. This is called stepping out, because it will cause the debugger to step over as many lines as it needs to until it jumps out of the function that it was in. For example, if you were inside the displayIntro() function on line 6, clicking Out would have the debugger keep stepping until the function was over and returned to the line after the call to displayIntro(). Stepping out can save you from having to click Step over and over again to jump out of the function.
If you are not inside a function (that is, you are in the global scope) and you click Out, the debugger will execute all the remaining lines in the program (exactly as if you clicked the Go button).
The last kind of stepping is done by the Over button in the Debug Control window, and it is for stepping over function calls. Stepping over means that the debugger will not step into function calls. Instead, the debugger executes all the code inside the function at once and only stop at the line after the function call. This is useful if you do not want to step through every single line inside the function.
You now know what the five buttons at the top of the Debug Control window do. Here's a recap:
- Go - Executes the rest of the code as normal, or until it reaches a break point. (Break points are described later.)
- Step - Step one line of code. If the line is a function call, the debugger will step into the function.
- Over - Step one line of code. If the line is a function call, the debugger will not step into the function, but instead step over the call.
- Out - Keeps stepping over lines of code until the debugger leaves the function it was in when Out was clicked. This steps out of the function.
- Quit - Immediately terminates the program.


